Number of Daily New Cases
The number of Daily New Cases is defined as the count of all newly diagnosed and reported cases of COVID-19 in the past 24 hours.
This is the most important number to track to understand how COVID-19 is spreading in the community.
When people talk about flattening the curve, they are referring to the graph of new cases reported over time.
We average the daily number of new cases over the past 7-days because variations in how people access healthcare and the amount of time required to process tests can lead to changes from day-to-day. For example, fewer medical offices are open on the weekend, so people are more likely to get tested on Monday and Tuesday than on Saturday and Sunday. Then, it may take 1-2 days from when the specimen is collected by the healthcare provider to when the result is reported to the Hawaii Department of Health. The number of newly reported cases on Wednesday, Thursday and Friday tends to be higher than on Sunday and Monday. By taking the 7-day average, we are always including the same days of the week so the number will not be influenced by these day-to-day variations.
Since COVID-19 is an infectious disease, each new person who gets infected has the potential to spread to many other people who can in turn spread the disease to many more people. When every person who gets sick spreads the disease to more than one person on average, this can lead to exponential growth which can overwhelm the healthcare system.
We closely monitor the trends in the epidemic curve to see if the number of new cases is increasing, decreasing or staying the same. The more that people follow public health recommendations (e.g. wearing a mask, staying six feet apart, washing their hands frequently, reducing their number of close contacts, and staying home if they feel sick) the better chance we have of flattening the curve.
The number of new cases may not always equal the number of new positive tests because of data cleaning (e.g. correcting the county of diagnosis) and minor lags in the time to confirm positive tests.

Testing Positivity Rate
The Testing Positivity Rate is defined as the percentage of all tests reported that are positive.
Percent positivity is another important metric to track in combination with the number of new cases to help understand how the virus is spreading in the community.
Percent positivity compares the number of newly reported cases to the number of people who were tested for the disease. This provides additional information, since our ability to detect new cases is largely determined by how many people are tested. If a lot of people who are sick are not getting tested, then the number of reported cases will go down, but the actual number of cases in the community could be increasing. If only the people who are severely ill are getting tested, then the percent positivity will be higher.
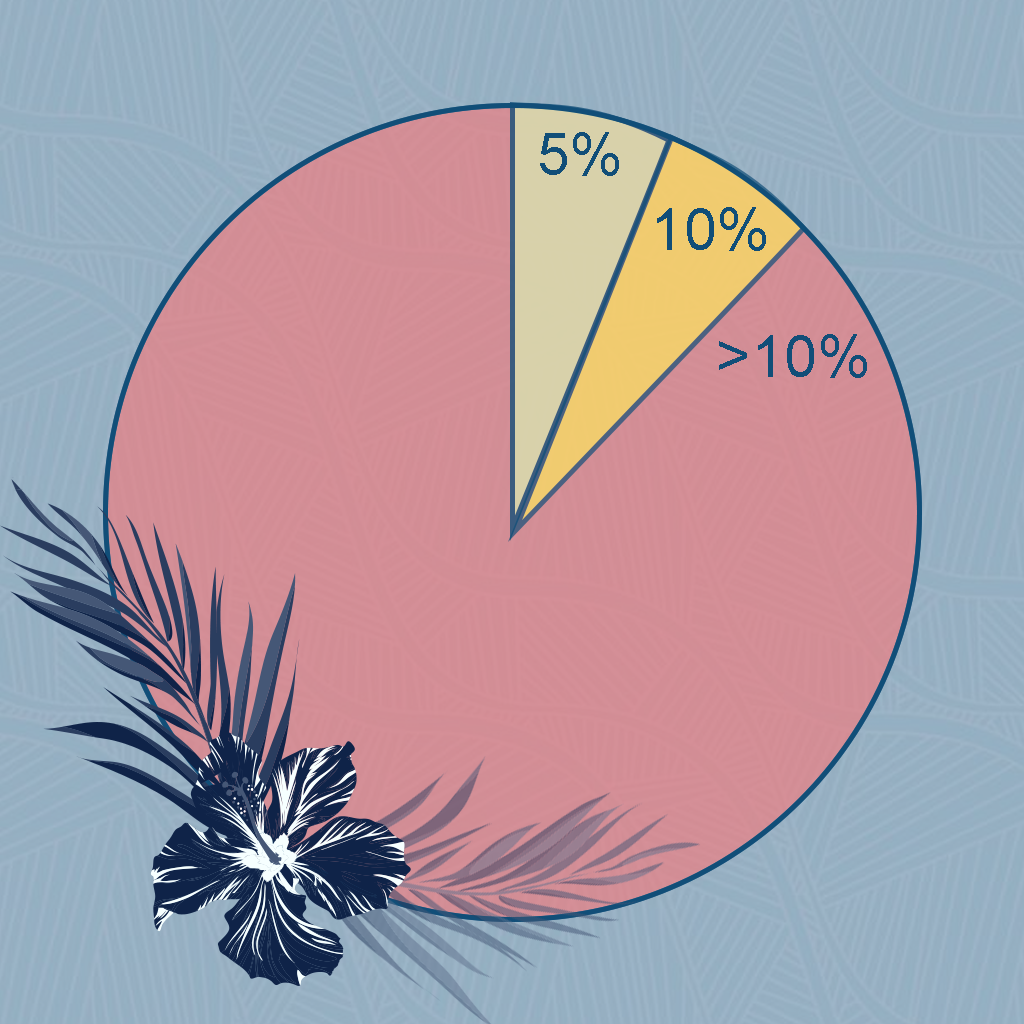
Ideally, the percent positivity should be below 5%. This usually indicates that the majority of people who are tested for the disease are not actually infected.
Percent Positivity should not be interpreted as the percent of the population who have the disease, since most people who are not infected will not get tested every day.
We calculate the percent positivity using the following formula:
(New Positive Tests, past 7 days) / (Total Test Encounters, past 7 days)
Total Test Encounters = New Positive Tests + All Negative Tests
Similar to the way we count daily new cases, we use a rolling 7-day average to account for the day-to-day variations we see in testing patterns, processing, and lags in the electronic reporting system.
The date on the chart is based on the date of the test (e.g. when the test result was reported).
An individual can only contribute one new positive test but can contribute multiple negative tests over time. This is because when using lab testing data for surveillance and monitoring, we want to compare the number of newly diagnosed cases to the total number of people who were tested each day.
We only include nucleic acid amplification tests which are the most accurate diagnostic tests available.
The number of new positive tests may not always equal the number of new cases because of data cleaning (e.g. correcting the county of diagnosis) and minor lags in the time to confirm positive tests.

Percent Change
The 14-day percent change in the average number of daily new cases is used to quantify the trend (i.e. whether disease activity is increasing or decreasing over time).
This is calculated by comparing the 7-day average of new cases on the most recent day to the 7-day average of new cases as of 14 days prior.
